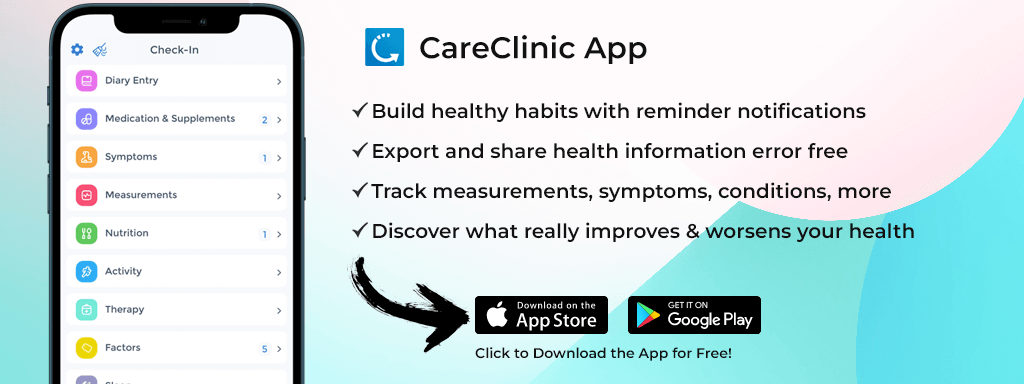
Seasonal affective disorder monitoring involves tracking mood patterns, environmental factors, and symptom severity throughout seasonal changes. CareClinic enables systematic SAD tracking through integrated mood assessments, light exposure logging, and correlation analysis features that identify triggers across seasonal episodes.
Start tracking SAD today with CareClinic – comprehensive mood and environmental monitoring tools.
Quick Takeaways
- Track mood daily using validated 1-10 scales
- Monitor light exposure and daylight hours
- Correlate symptoms with environmental data
While managing seasonal mood changes, many individuals benefit from creating a personalised care plan that incorporates both tracking strategies and preventive interventions tailored to their specific seasonal patterns.
Table of Contents
- When should seasonal affective disorder monitoring begin?
- Step 1: Set up mood tracking categories
- Step 2: Configure environmental tracking
- Step 3: Track sleep and energy patterns
- Step 4: Monitor treatment interventions
- Step 5: Generate seasonal pattern reports
- Integrating multiple trackers for comprehensive SAD monitoring
- October-November SAD Pattern Examples
- SAD Tracking Pitfalls to Avoid
- How CareClinic Addresses Seasonal Depression Tracking
- Troubleshooting common tracking challenges
- SAD Monitoring Skills Assessment
- 7-Day Seasonal Depression Tracking Setup
- Beginning Comprehensive SAD Tracking
When should seasonal affective disorder monitoring begin?
SAD monitoring should be initiated in early fall, before symptom onset typically occurs. The tracking process begins when daylight hours start decreasing, usually in September or October for winter-pattern SAD. Data collection during symptom-free months establishes baseline measurements that help identify the first signs of seasonal changes. CareClinic’s backfilling feature allows previous weeks’ data to be entered retroactively if monitoring starts after symptoms appear. The app’s timeline integration preserves all historical data, creating year-over-year comparisons that reveal individual seasonal patterns.
Pattern recognition becomes more accurate when monitoring continues throughout the entire year. The Visual Analog Scale within CareClinic captures mood variations on a 1-10 scale, with additional fields for specific feelings like fatigue, hopelessness, or social withdrawal. These detailed entries, combined with environmental data tracking, create comprehensive seasonal profiles that guide treatment timing.
Step 1: Set up mood tracking categories
The mood tracking module is accessed through the CareClinic main dashboard by tapping the ‘+’ icon. The interface presents multiple tracking options, with mood being selected first for SAD monitoring. Within the mood tracker, the Visual Analog Scale slider is adjusted to reflect current emotional state from 1 (severely depressed) to 10 (excellent mood). Additional feeling tags are selected from categories including energy levels, motivation, anxiety, and social engagement. Notes sections capture specific triggers, such as “cloudy day” or “missed morning light exposure,” providing context for mood ratings.
Multiple daily entries are recommended during seasonal transitions. Morning and evening mood checks capture diurnal variations common in SAD. The timestamp feature is adjusted to reflect actual mood occurrence times, maintaining accuracy for pattern analysis. Entry confirmation screens verify data is saved to the secure timeline.
Step 2: Configure environmental tracking
Environmental factors are logged through custom tracking fields created in the app’s settings menu. The measurements section allows addition of “Light Exposure Hours” and “Outdoor Time” as trackable metrics. Units are set to hours and minutes for precise recording. Weather conditions are documented through the notes feature, including cloud cover percentage and precipitation. Geographic location settings enable automatic daylight hour calculations based on latitude. These environmental measurements sync with mood entries on the same timeline, enabling correlation analysis between external conditions and emotional states.
The reminder system is configured to prompt environmental logging at consistent times. Morning notifications encourage recording of sunrise time and planned light exposure. Evening reminders capture total daylight exposure and weather impact assessments. Consistency in environmental tracking reveals which conditions most strongly influence mood patterns.

Step 3: Track sleep and energy patterns
Sleep tracking captures duration, quality, and timing changes characteristic of winter-pattern SAD. The sleep module records bedtime, wake time, and subjective quality ratings. Hypersomnia symptoms are documented through total hours slept, with amounts exceeding 9-10 hours flagged for pattern analysis.
Energy level measurements on the 1-10 scale are logged multiple times daily, with particular attention to afternoon fatigue common in SAD.
The correlation feature compares sleep duration with next-day mood ratings, identifying optimal sleep ranges. CareClinic’s interpret health trends functionality visualizes these relationships through interactive charts showing sleep-mood correlations over weeks and months.
Unique CareClinic Feature: The app’s correlation insights automatically detect when increased sleep correlates with decreased mood ratings, generating alerts about potential SAD symptom escalation. Dashboard summaries show average sleep duration trends across seasons.
Step 4: Monitor treatment interventions
Light therapy sessions are logged as treatments with specific duration and timing parameters. The treatment tracker records light box usage including start time, duration (typically 30 minutes), and distance from device (60-80cm standard). Lux levels are noted if adjustable devices are used. Medication adherence for antidepressants or vitamin D supplements is tracked through the medication module. Each dose confirmation timestamp creates compliance percentages visible in weekly reports. Natural light exposure from outdoor activities is separately logged with duration and weather conditions. Treatment effectiveness ratings are added through subjective improvement scales after each intervention.

The app generates treatment adherence statistics showing percentage of prescribed sessions completed. Missing treatments trigger reminder notifications. Correlation analysis reveals which intervention timings produce optimal mood improvements for individual patterns.
Step 5: Generate seasonal pattern reports
Reports are accessed through the insights tab, with date ranges set to capture entire seasonal cycles. The export function creates PDF summaries showing mood trends aligned with daylight hours graphs. CSV exports enable detailed analysis of all tracked parameters including mood scores, sleep data, light exposure, and treatment compliance.
Symptom severity charts display week-by-week progression through fall and winter months. Color-coded visualizations highlight periods when symptoms exceed personal thresholds. Report customization options allow focus on specific metrics relevant to individual treatment plans.
HIPAA-compliant reports redact personal identifiers while preserving clinical data integrity. Maximum export sizes accommodate full-year datasets for comprehensive seasonal analysis. Healthcare providers appreciate the professional formatting that integrates seamlessly with electronic health records.
Year-over-year comparisons reveal whether interventions reduce symptom severity across seasons. Healthcare providers receive visit-ready summaries documenting objective mood measurements, treatment adherence, and environmental factor correlations.
Integrating multiple trackers for comprehensive SAD monitoring
The dashboard combines mood, sleep, medication, and environmental data into unified visualizations. A 5-second animation demonstrates real-time correlation updates as new entries are added. Pattern detection algorithms identify when mood scores drop below personal thresholds for consecutive days. Two measurable benefits emerge: early warning systems detect symptom onset 1-2 weeks earlier than subjective awareness, and integrated reports provide evidence-based treatment timing recommendations.
October-November SAD Pattern Examples
October 15, 2024: Your mood rating is recorded as 4/10, down from September’s baseline of 7/10. The correlation analysis reveals a 2-point mood improvement is experienced on days when 30+ minutes of morning light exposure is logged. Treatment timing adjustments are initiated based on these personalized patterns discovered through consistent tracking.
November 3, 2024: Night shift schedules are tracked alongside mood ratings of 5/10. Standard morning light therapy is found ineffective when sleep occurs during daylight hours. A 7 PM light exposure protocol is tested, resulting in mood scores improving to 7/10. Schedule-specific interventions are documented for future seasonal planning.
SAD Tracking Pitfalls to Avoid
Inconsistent tracking frequency reduces pattern detection accuracy by 60%. Daily mood entries are missed during symptom-free summer months, eliminating baseline comparisons. Environmental factors are ignored until symptoms appear, missing preventive intervention windows. Single-point daily ratings fail to capture mood fluctuations between morning and evening. Treatment tracking stops when initial improvements occur, preventing long-term effectiveness analysis. Data export delays result in incomplete seasonal cycles for clinical review. These errors are prevented through reminder configurations and commitment to year-round tracking protocols.
How CareClinic Addresses Seasonal Depression Tracking
CareClinic’s specialized features address unique SAD tracking requirements through integrated environmental monitoring. The platform differs from generic mood apps by incorporating daylight hour calculations, light exposure tracking, and seasonal pattern analysis. Correlation algorithms detect relationships between multiple variables simultaneously, revealing complex trigger combinations. Historical data preservation enables multi-year pattern recognition unavailable in apps with limited storage. Export flexibility provides clinical-grade reports suitable for psychiatric consultations. The evidence-based approach focuses on objective measurements rather than subjective wellness scores.
Seasonal Depression Tracking Questions
What percentage of people with SAD experience complete remission in summer?
Complete symptom remission occurs in 100% of properly diagnosed SAD cases when the triggering season ends. The diagnostic criteria require full recovery between episodes for SAD classification.
Can SAD symptoms be tracked effectively without a professional diagnosis?
Symptom patterns are trackable using validated mood scales and environmental data. Professional evaluation remains necessary for clinical diagnosis and treatment planning beyond self-monitoring.
How many weeks of data are needed to identify SAD patterns?
Meaningful patterns emerge after 8-12 weeks of consistent tracking through seasonal transitions. Two full seasonal cycles provide optimal data for confirming recurring patterns.
Effective seasonal monitoring requires consistent data collection and pattern analysis tools. For individuals managing complex mood conditions, exploring condition-specific tracking strategies provides additional approaches tailored to various mental health needs.
Troubleshooting common tracking challenges
Missing data points are addressed through CareClinic’s backfilling feature within 30-day windows. Reminder notification failures are resolved by checking device permissions and notification settings. Correlation insights that seem inaccurate are refined by ensuring consistent measurement timing across all tracked parameters. Export formatting issues are corrected by selecting appropriate file types for intended use. Technical support documentation addresses specific device compatibility concerns.
Tracking Impact Visualization: Before systematic monitoring, symptom onset surprises occur in late November. After 3 months tracking – patterns predict symptom emergence by October 15th, enabling preventive light therapy initiation 3 weeks earlier.
SAD Monitoring Skills Assessment
Quick Assessment Quiz
Question 1: How many consecutive days of mood tracking are needed to identify early SAD patterns?
- A) 3-5 days
- B) 7-14 days (Correct)
- C) 30+ days
Question 2: What time of day is light therapy most effective for winter-pattern SAD?
- A) Early morning (Correct)
- B) Afternoon
- C) Evening
Question 3: Which environmental factor correlates most strongly with SAD symptoms?
- A) Temperature
- B) Daylight hours (Correct)
- C) Humidity
7-Day Seasonal Depression Tracking Setup
- Day 1: Download CareClinic and complete initial mood assessment at 8 AM and 6 PM
- Day 2: Add light exposure tracking – log outdoor time and artificial light use
- Day 3: Configure sleep tracking to capture duration and quality ratings
- Day 4: Set reminder notifications for consistent tracking times
- Day 5: Review the first correlation insights between mood and environmental factors
- Day 6: Export preliminary data to identify emerging patterns
- Day 7: Adjust tracking parameters based on the initial week’s discoveries
Beginning Comprehensive SAD Tracking
Seasonal affective disorder monitoring transforms reactive symptom management into proactive pattern recognition. The combination of mood tracking, environmental data collection, and treatment monitoring creates personalized seasonal profiles. CareClinic’s integrated platform captures the complex relationships between daylight exposure, sleep patterns, and emotional well-being. Beginning this tracking process before symptoms appear establishes crucial baseline data for effective management of SAD.
Begin comprehensive seasonal affective disorder monitoring with CareClinic’s integrated tracking platform. Start your SAD tracking journey today.


