Weather Tracker: See How Climate Affects Your Health
Track barometric pressure, temperature, and atmospheric conditions to understand weather-triggered symptoms.
Monitor environmental factors alongside your health data to uncover how weather changes trigger migraines, arthritis flares, respiratory issues, and lupus symptoms. From automatic pressure tracking to pattern notifications, take control of weather-sensitive conditions.
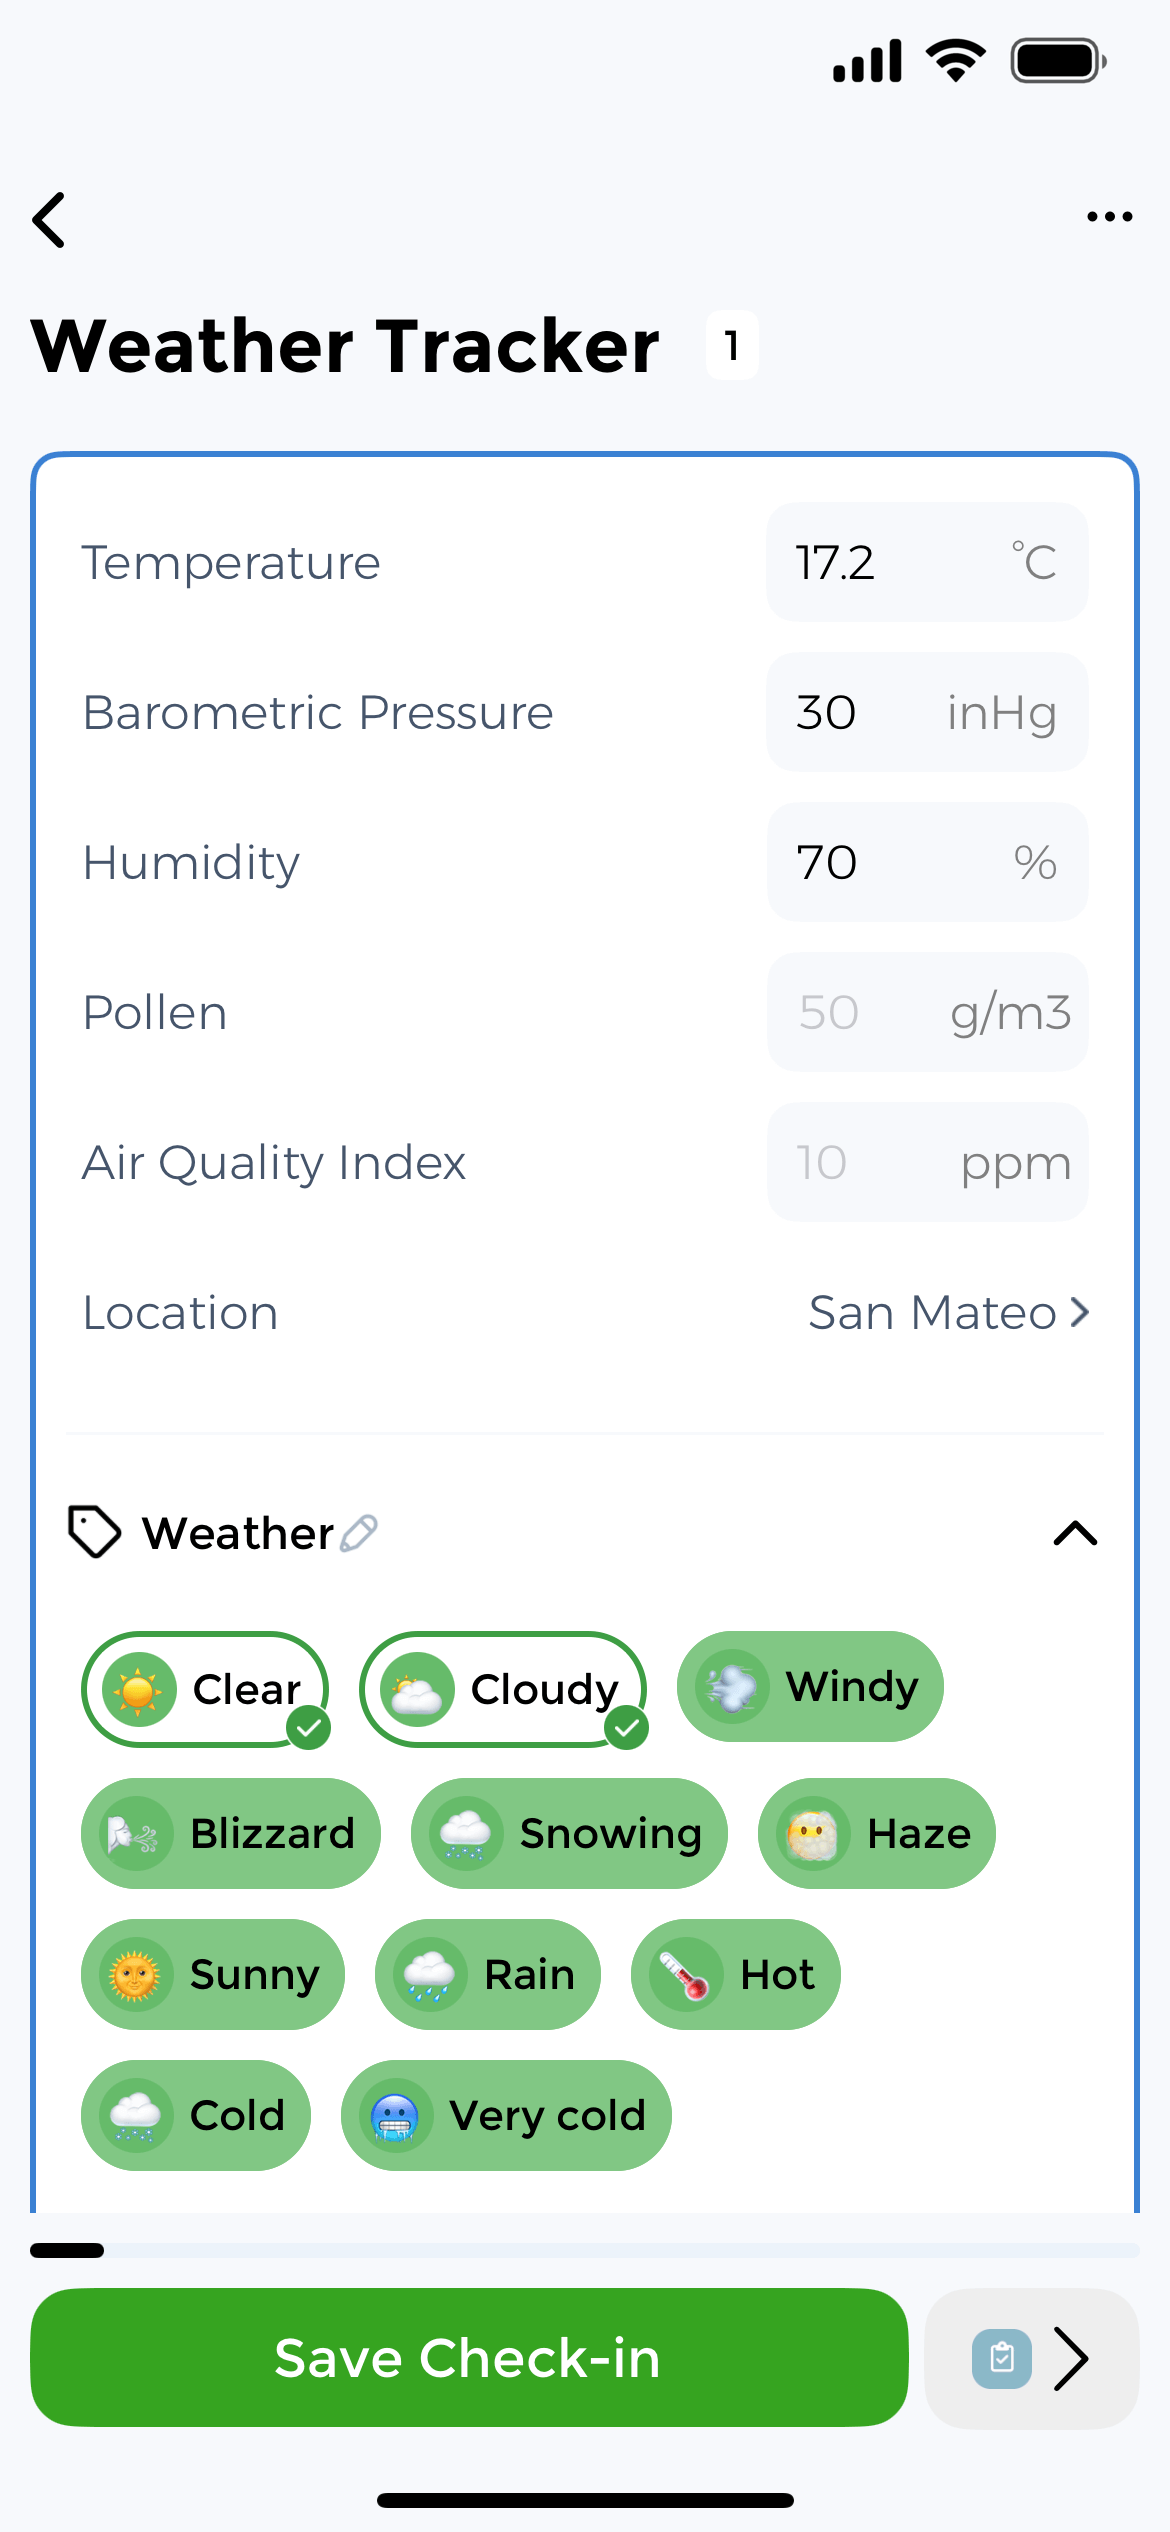
Track Weather, Discover Health Connections
Monitor how atmospheric pressure, temperature changes, and weather conditions affect your symptoms. Whether managing migraines, arthritis, chronic pain, respiratory conditions, lupus, or multiple sclerosis, automatic weather tracking reveals environmental triggers you can’t see but your body feels.
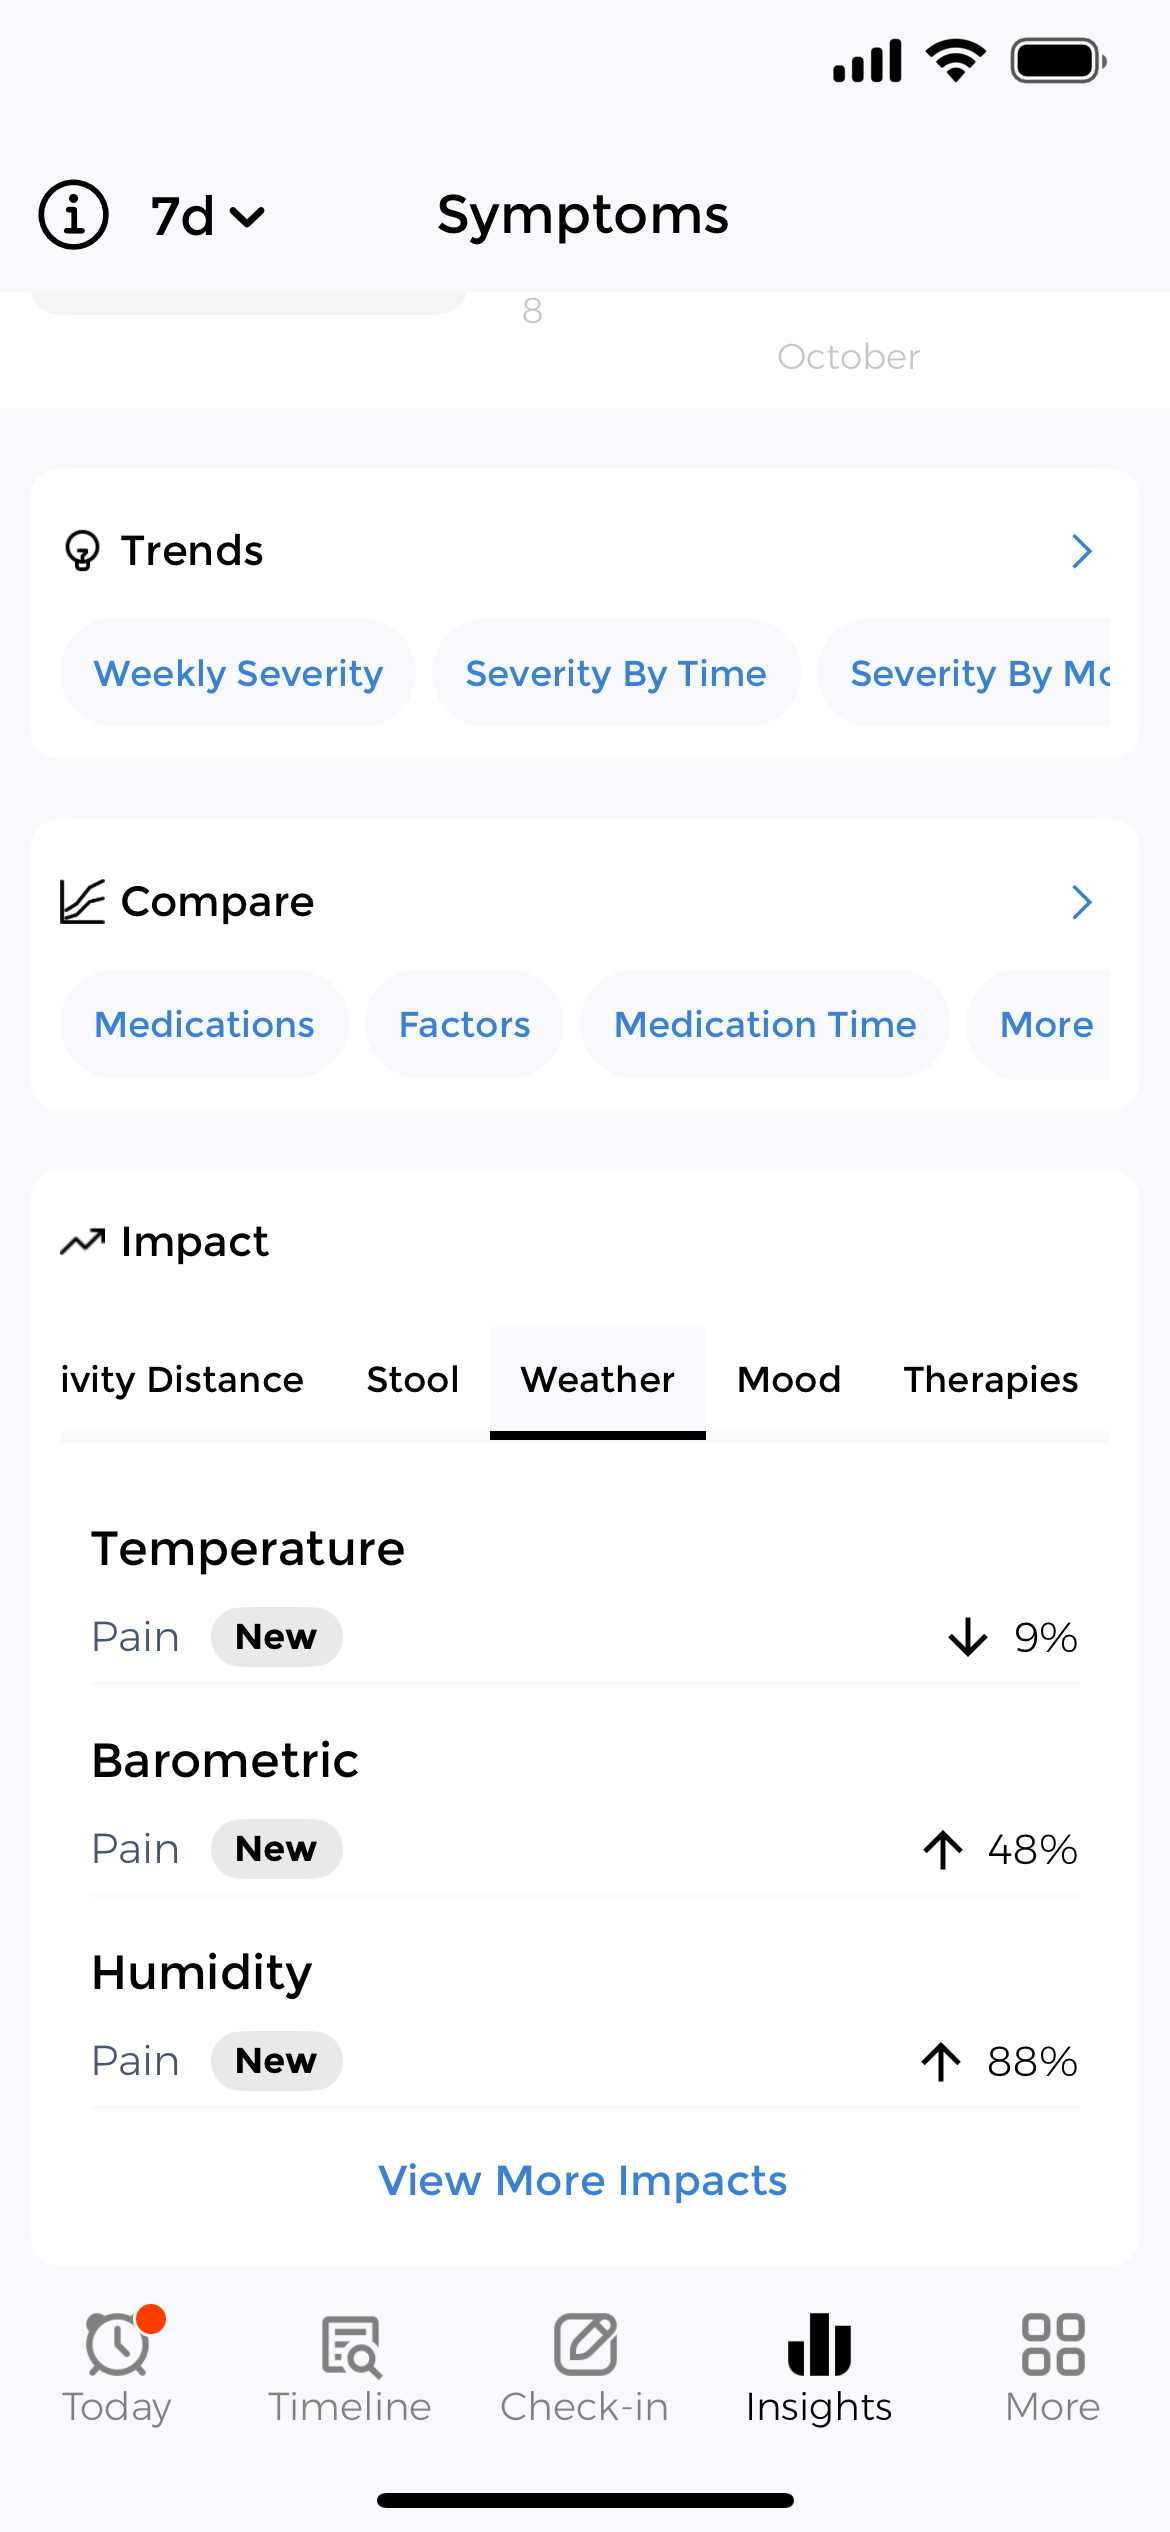
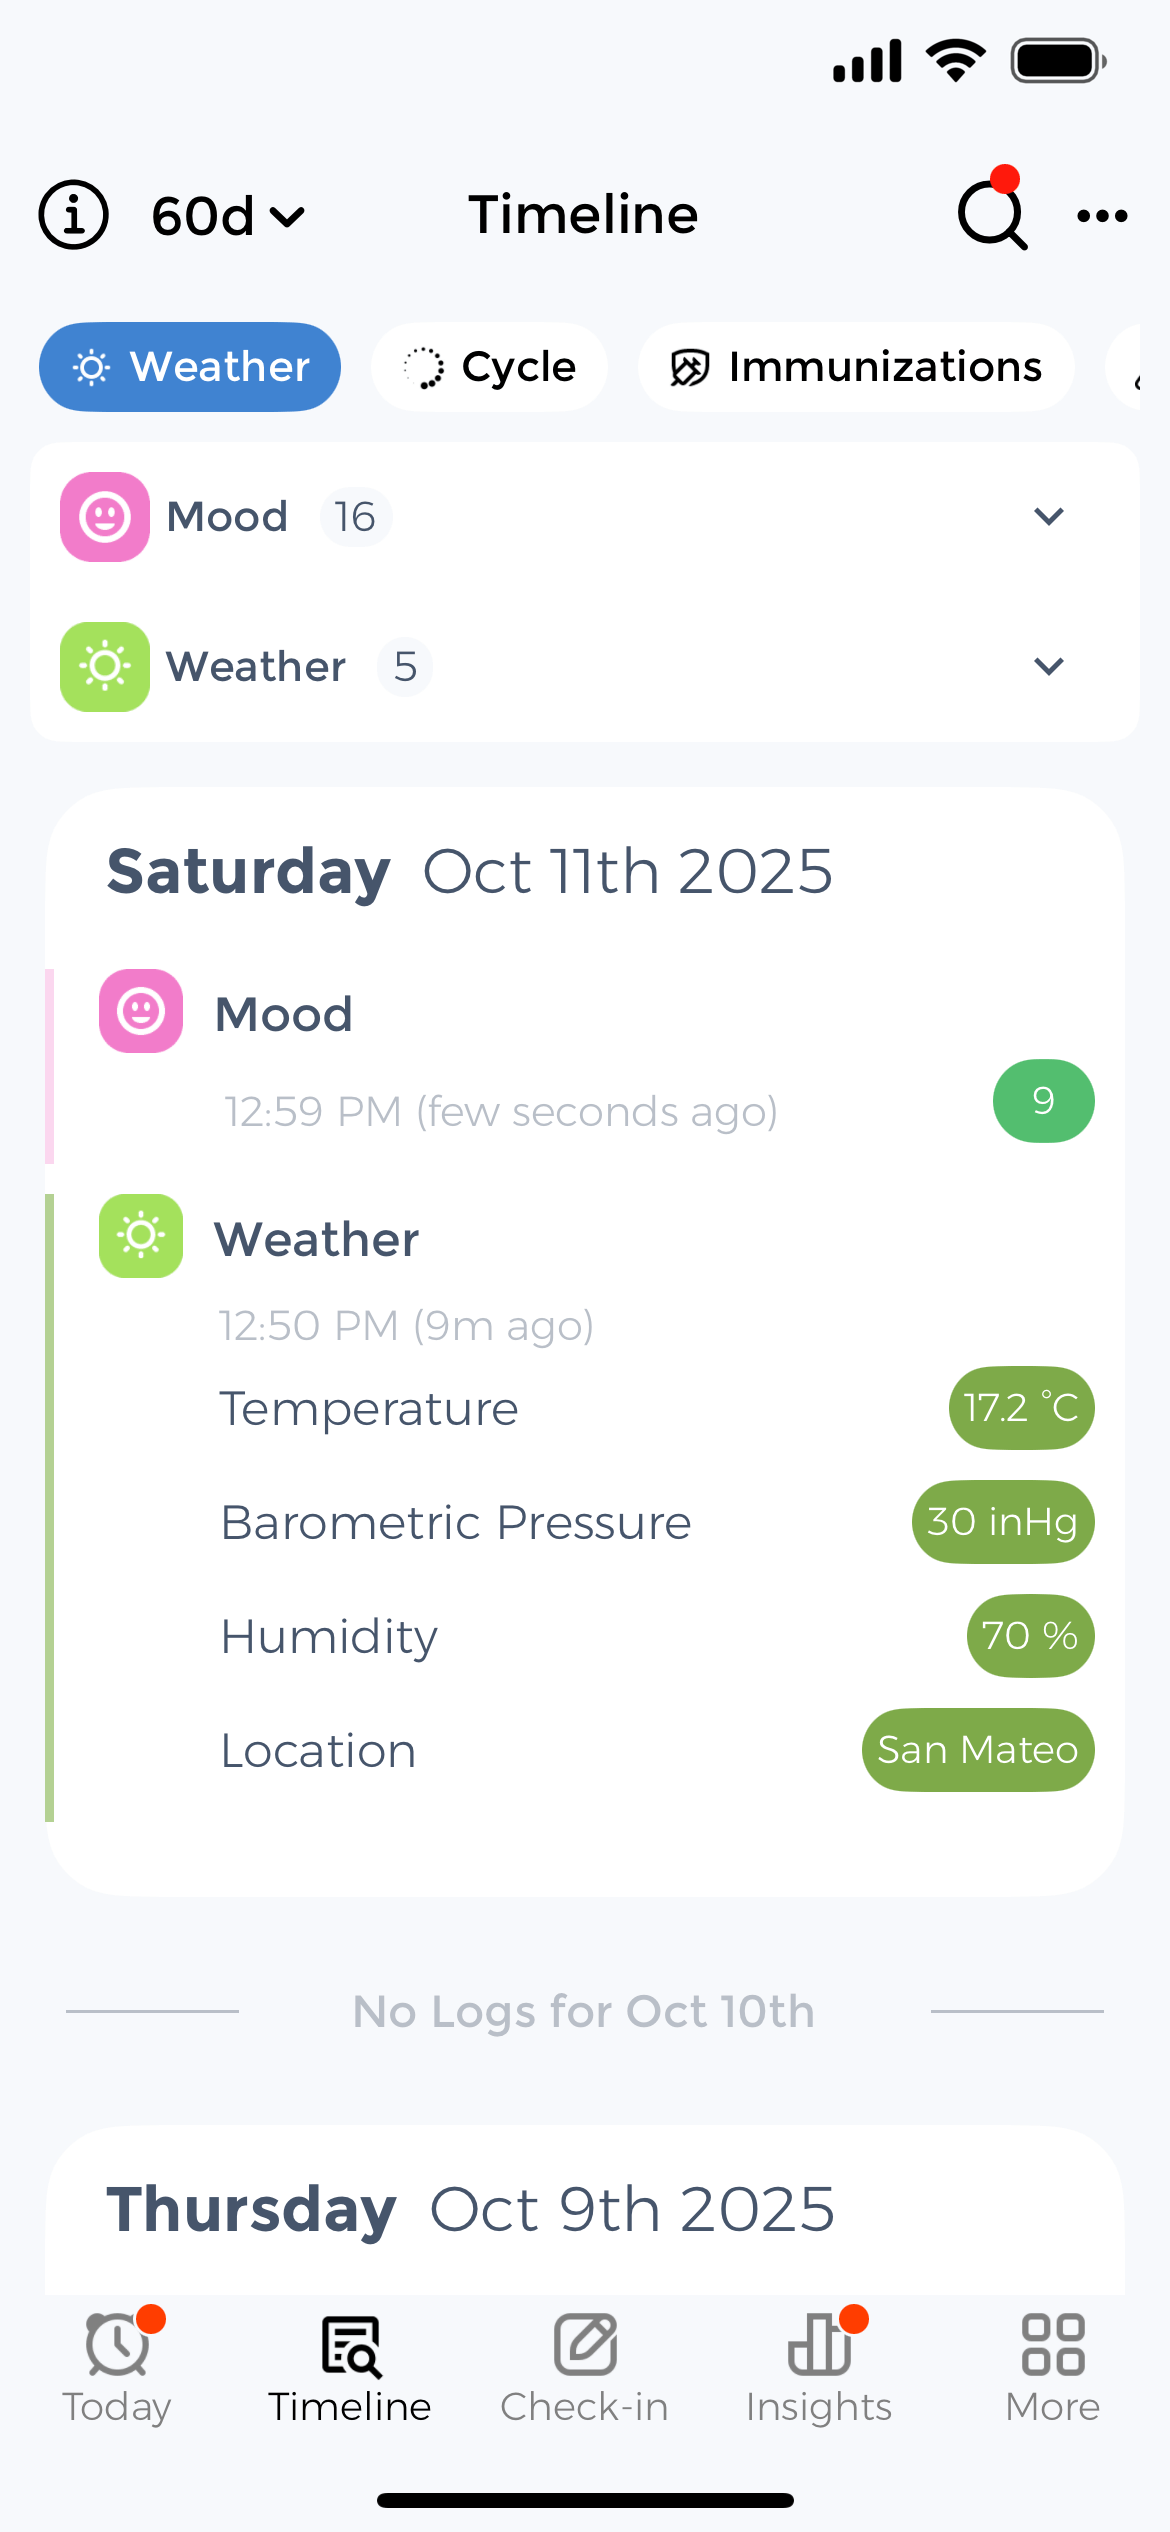
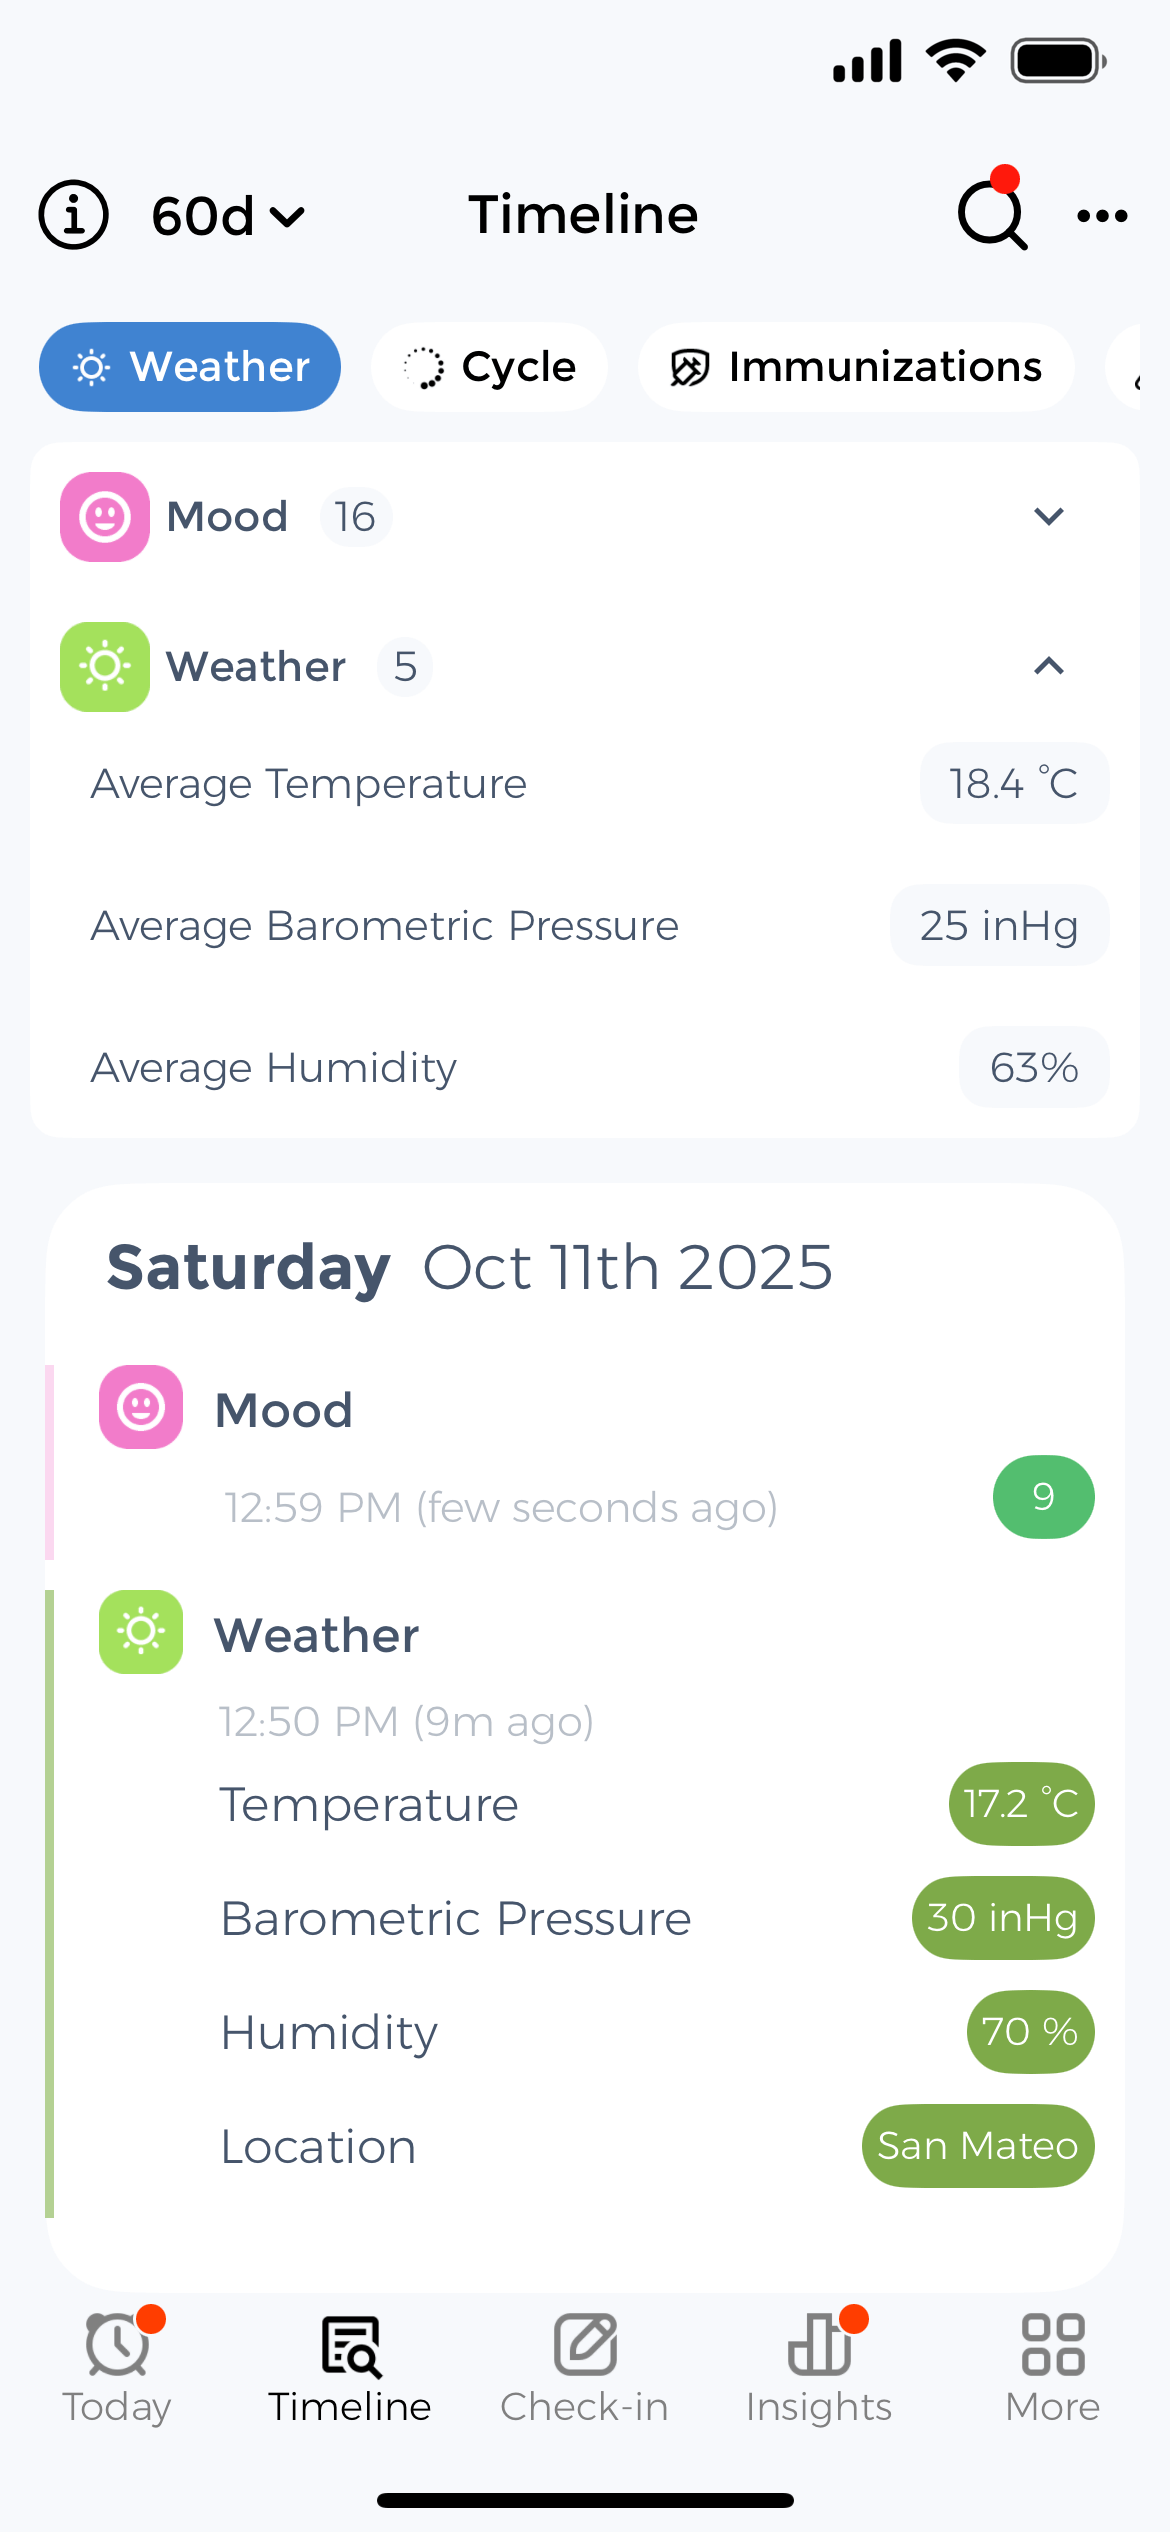
Automatically track atmospheric pressure changes that trigger migraines, joint pain, respiratory issues, and chronic fatigue. The app logs pressure readings in real-time and correlates them with your symptom entries to identify when pressure drops or rises affect your health most severely.
Record daily temperature variations and humidity levels to understand how cold fronts, heat waves, or damp conditions impact arthritis pain, asthma symptoms, fibromyalgia flares, and skin conditions like eczema. Visual charts show temperature patterns alongside your health metrics for clear cause-and-effect relationships.
Get notified when current weather conditions match patterns that previously triggered your symptoms. If barometric pressure drops consistently worsen your migraines, the system alerts you when similar pressure changes are occurring so you can take appropriate action with medications or rest.
Automated Weather Intelligence
Smart monitoring systems automatically capture weather data, identify trigger patterns, and support medical documentation without manual effort.
Location-Based Tracking
Automatic weather data for your exact location with multi-location support for travelers.
Pattern Recognition
AI identifies which weather conditions trigger your symptoms through statistical analysis.
Historical Weather Data
Access past weather records to retrospectively analyze symptom flares and confirm triggers.
Provider Reports
Share weather correlation data with doctors to support environmental trigger diagnoses.
Simple Three-Step Weather Analysis
Enable automatic weather tracking, log your symptoms as they occur, and review correlation reports to identify environmental triggers affecting your health.
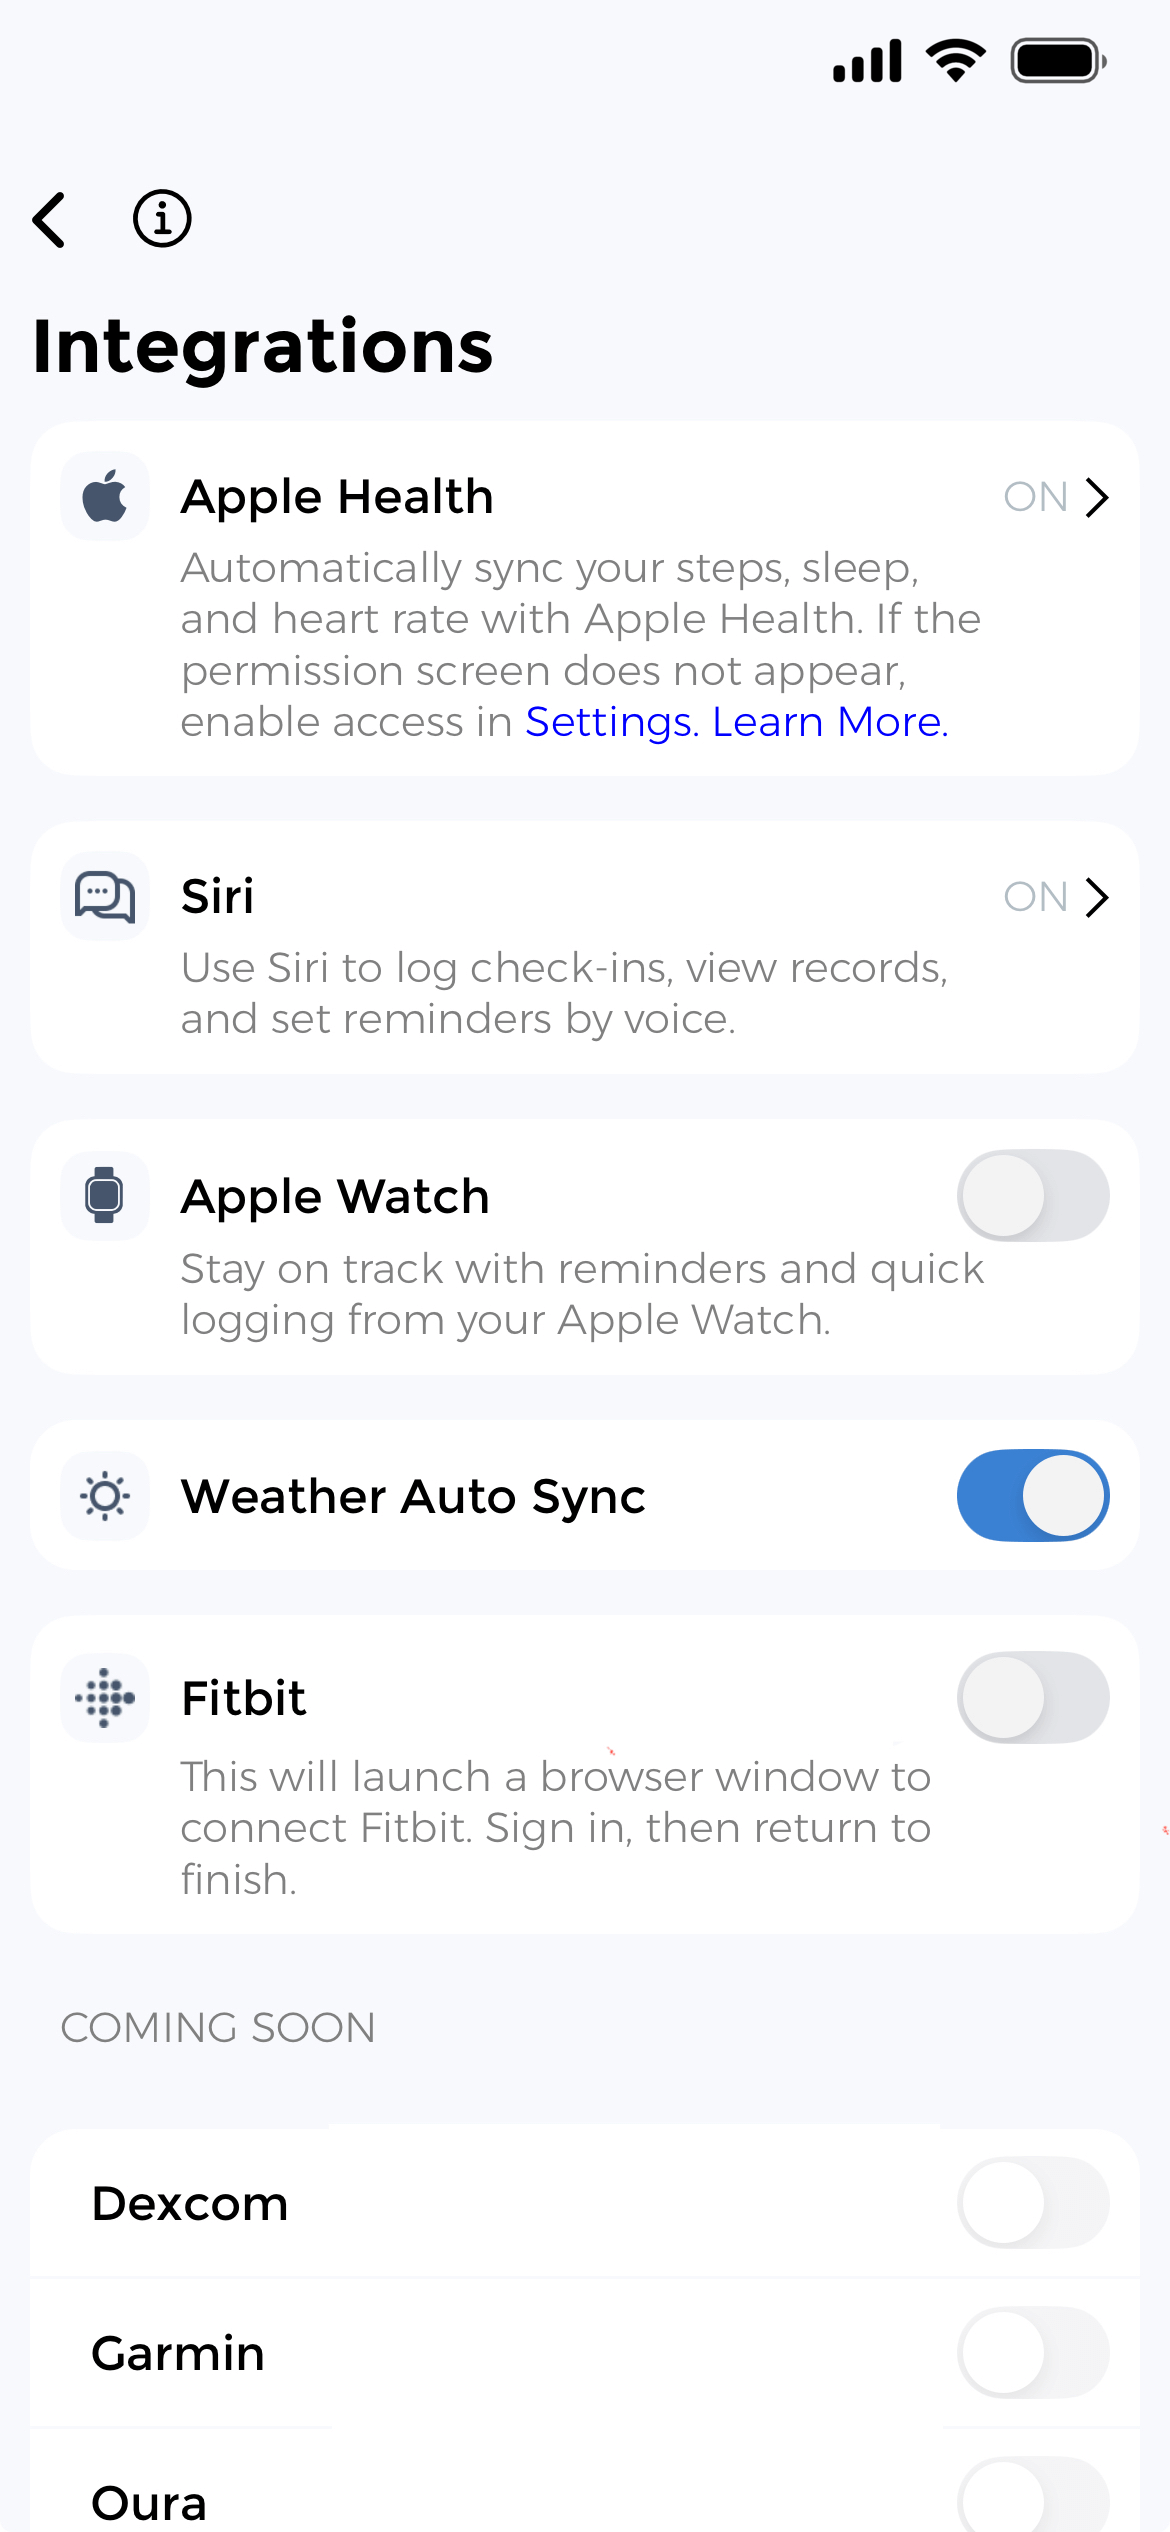
Enable Weather Sync
Turn on automatic weather tracking to pull barometric pressure, temperature, humidity, and conditions data for your location without manual entry.
Log Your Symptoms
Record migraine attacks, pain levels, respiratory issues, or mood changes as they happen while weather data logs automatically in the background.
Analyze Correlations
View comprehensive reports showing which weather patterns coincide with your worst symptoms and receive notifications when similar conditions occur again.
Conditions Affected by Weather Changes
From neurological disorders to musculoskeletal conditions, weather sensitivity impacts millions. Track environmental factors to manage weather-triggered symptoms proactively.
Migraines & Headaches
30-50% of migraine sufferers identify weather as a primary trigger. Barometric pressure drops cause blood vessel changes that lead to intense headaches, making pressure monitoring essential for preventive treatment and planning.
Arthritis & Joint Pain
Cold, damp weather and pressure changes worsen arthritis pain through joint fluid alterations and tissue expansion. Track weather patterns to identify your personal pain thresholds and adjust activity levels accordingly.
Fibromyalgia Flares
Temperature extremes, humidity, and sudden weather changes trigger widespread pain and fatigue in fibromyalgia patients. Weather tracking helps anticipate difficult days and schedule rest appropriately.
Lupus & Autoimmune Conditions
Sun exposure and temperature changes significantly impact lupus symptoms, causing fatigue, joint pain, and flares. Tracking UV exposure, heat patterns, and weather transitions helps manage photosensitivity and identify environmental triggers unique to autoimmune conditions.
Asthma & Respiratory Issues
Cold air, humidity changes, and atmospheric pressure variations affect breathing capacity and trigger asthma attacks, COPD symptoms, and sinus pressure. Monitor weather to prepare rescue inhalers and avoid outdoor exposure during high-risk conditions.
Chronic Pain Syndromes
Complex regional pain syndrome, neuropathy, and other chronic pain conditions often worsen with weather changes. Identifying specific triggers through data helps validate your experience and guide treatment decisions.
Multiple Sclerosis (MS)
Heat sensitivity is a hallmark MS symptom, with elevated temperatures temporarily worsening fatigue, vision problems, and mobility. Temperature tracking helps MS patients avoid heat exposure, plan cooling strategies, and distinguish weather-triggered symptom flares from disease progression.
Mood & Mental Health
Seasonal affective disorder, depression, and anxiety can intensify with weather changes. Track sunny days, light exposure, and atmospheric conditions alongside mood to understand environmental mental health triggers.
Why Track Weather for Health Management
Weather tracking transforms vague feelings about climate sensitivity into concrete data that validates your experience and guides medical care.
Validate Weather Sensitivity
Systematic tracking proves environmental trigger connections with data, helping doctors understand your weather sensitivity and adjust treatment plans rather than dismissing symptoms.
Recognize Symptom Patterns
Pattern notifications alert you when pressure drops, cold fronts, or triggering weather occurs so you can take migraine medication promptly or adjust pain management strategies.
Reduce Medical Uncertainty
Weather correlation reports provide objective evidence for healthcare discussions. Show your rheumatologist how humidity affects joint pain or demonstrate to your neurologist that pressure changes precede migraines.
Respond to Bad Weather Days
Real-time alerts notify you when pressure drops or cold fronts match your known trigger patterns, allowing prompt medication response and activity adjustments for arthritis pain management.
Isolate True Weather Triggers
Multi-factor correlation analysis separates weather effects from confounding variables like poor sleep, stress, or diet to identify if barometric pressure alone causes symptoms.
Improve Quality of Life
Understanding weather-health relationships reduces symptom anxiety. Gain control through preparation, preventive medication, and strategic planning that minimizes weather’s impact on daily functioning.
Understand Your Weather Triggers
Migraines before storms? Arthritis flares in cold, damp weather? MS symptoms worse in heat? Exhausted when pressure drops? CareClinic shows exactly how barometric pressure, temperature, and humidity trigger your symptoms. Track weather automatically, spot patterns you’d miss manually, and prepare for bad days. Stop guessing. Start understanding your weather triggers with data.
Find Your Exact Weather Triggers
Beyond basic weather logging, access specialized environmental monitoring tools designed to reveal complex weather-health relationships and support data-driven symptom management.
Multi-Factor Correlation Analysis
Analyzes weather alongside medications, sleep, diet, stress, and activity to isolate weather’s true impact versus confounding factors. Discover if pressure alone causes migraines or if combined factors create triggers.
Symptom Lag Tracking
Identify if symptoms appear during weather changes or hours afterward. Some experience migraines as pressure drops while others react 12-24 hours later. Time-shifted analysis reveals your personal response pattern.
Travel Weather Monitoring
Automatically switches weather tracking to your current location when traveling. Compare how coastal humidity affects you versus dry inland air or high-altitude conditions.
Seasonal Trend Analysis
View long-term weather patterns to understand if symptoms worsen in winter cold, summer heat, or seasonal transitions. Historical data reveals sensitivity to specific seasons or weather event types.
Customizable Pattern Alerts
Set personalized thresholds for pressure drops, temperature extremes, or humidity changes that trigger symptoms. Receive notifications when conditions match your trigger patterns for quick response with treatments or adjustments.
Multiple Condition Tracking
Track different weather sensitivities for multiple conditions simultaneously. Monitor how pressure affects migraines while tracking temperature’s impact on arthritis and humidity’s influence on asthma, with separate reports for each.
Your Data Stays Private
Bank-level encryption, HIPAA compliance, and anonymous location services keep your weather-health data secure. You control who sees your information, and it’s never sold or shared without your permission.
Frequently Asked Questions
Common questions about weather tracking, symptom correlation, and using CareClinic’s monitoring features.


